The Bug Only My Screen Could See
A flicker in the Voomero editor did not appear in browser captures or traces. A short screen recording helped me find what needed to change.
This week, while working on Voomero, I noticed a flicker in the studio, the part of the product where you edit a video before exporting it. When I dragged the seek bar backward, part of the page briefly disappeared. It was most visible in the timeline at the bottom. I could clearly see it on my physical screen, but the browser and headless captures did not show it.
I first thought it might be a memory leak or a problem with how often the interface rendered. The measurements did not support either explanation. The fix ended up being one CSS property on a few small elements, but understanding where to apply it took much longer.
I worked through this with Claude Code. It wrote and ran most of the scripts used to measure the problem, while I tested the editor on my own screen. I want to explain how we found it, including the checks that did not lead to the answer, because they changed what I looked at next.
When the Page Flickered
The studio has a video preview at the top, controls below it, and a panel on the right. The timeline sits at the bottom, with a strip of thumbnails for each scene. Moving the seek bar changes the position in the video and updates the playhead, the line that marks that position on the timeline.
The flicker was worse when I dragged backward into the gallery scene, which shows several photos at once. The video was paused during these tests, so the updates came from moving the seek bar rather than normal playback.
What I Checked First
I started with the interface code. I wanted to know whether dragging caused unnecessary renders, reloaded the thumbnails, or removed part of the page before adding it back.
We opened the studio in a headless browser, a browser running without a visible window, and automated the mouse drag. We logged changes to the page throughout the interaction. The changes were the ones I expected: the playhead moved, the progress fills changed, and the time labels updated. No image reloaded, and no part of the timeline was removed and added back.
I have reached for memo and useMemo before when a React interface felt slow. But here, the parts updating were the parts whose values had changed. Skipping those updates would not have been useful.
Next, we checked for a leak by dragging back and forth six times. After each pass, the number of DOM nodes, the number of event listeners, and the size of the JavaScript heap returned to the same values. Nothing in those measurements suggested that the interaction was accumulating memory.
I also considered GPU memory. Chrome stores painted content in textures, and those textures use memory on the GPU. I thought the gallery scene might be pushing the tab beyond its available budget. But Chrome's trace showed a peak of 212 MB and no budget exhaustion in about 2,500 checks across two runs.
There was another problem with the investigation: none of these tests reproduced the flicker. We captured 661 frames during the same kind of drag, using the same Chrome version I use every day. Every capture showed the timeline intact.
The checks helped rule out some explanations, but they still did not show the problem I could see on my screen.
The 224-Pixel Clue
I then recorded my screen while dragging the seek bar. The recording was six and a half seconds long. We split it into 156 frames so we could inspect them individually:
ffmpeg -i recording.mp4 -fps_mode passthrough frames/f-%03d.pngThree frames showed part of the page missing. The example below uses frames from that recording. I have hidden the product details and cropped out the settings panel, while keeping the visible background, playback controls, and missing tile boundaries unchanged. Step through the frames to see the flicker, then turn on the tile rows to compare the missing areas with their boundaries.
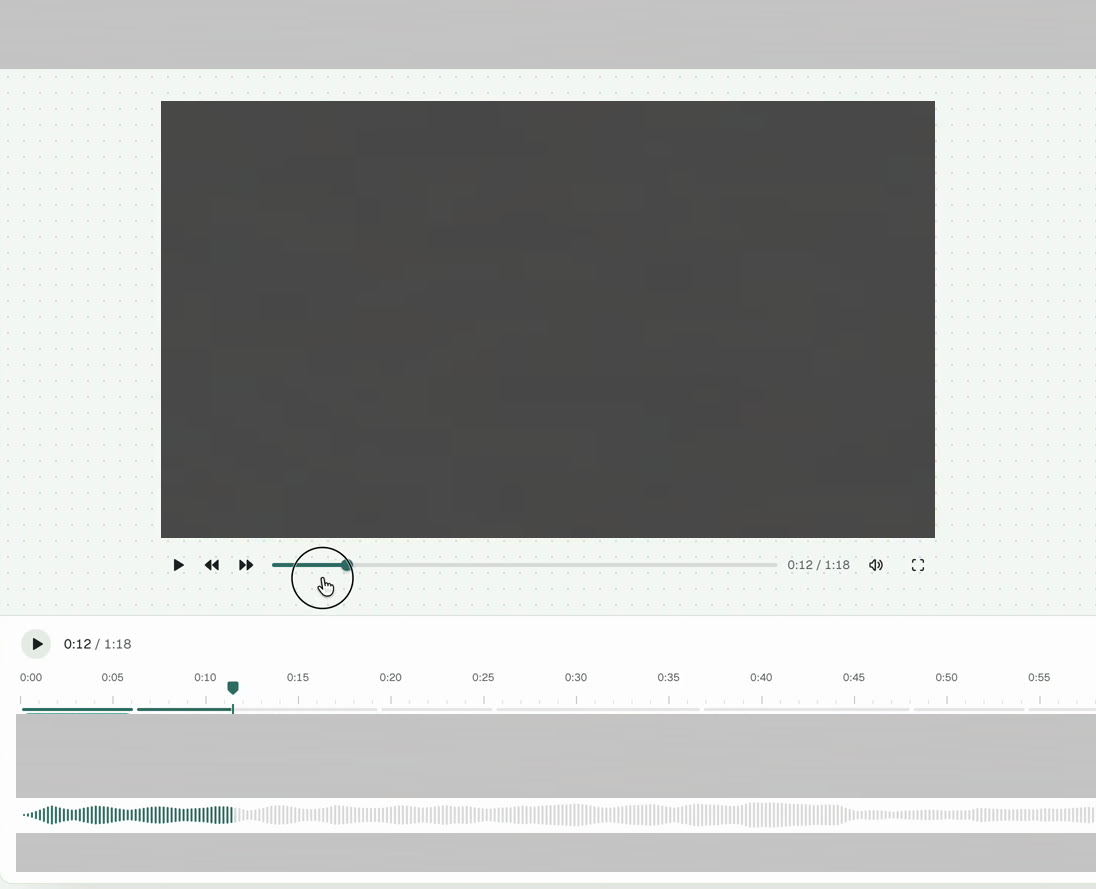
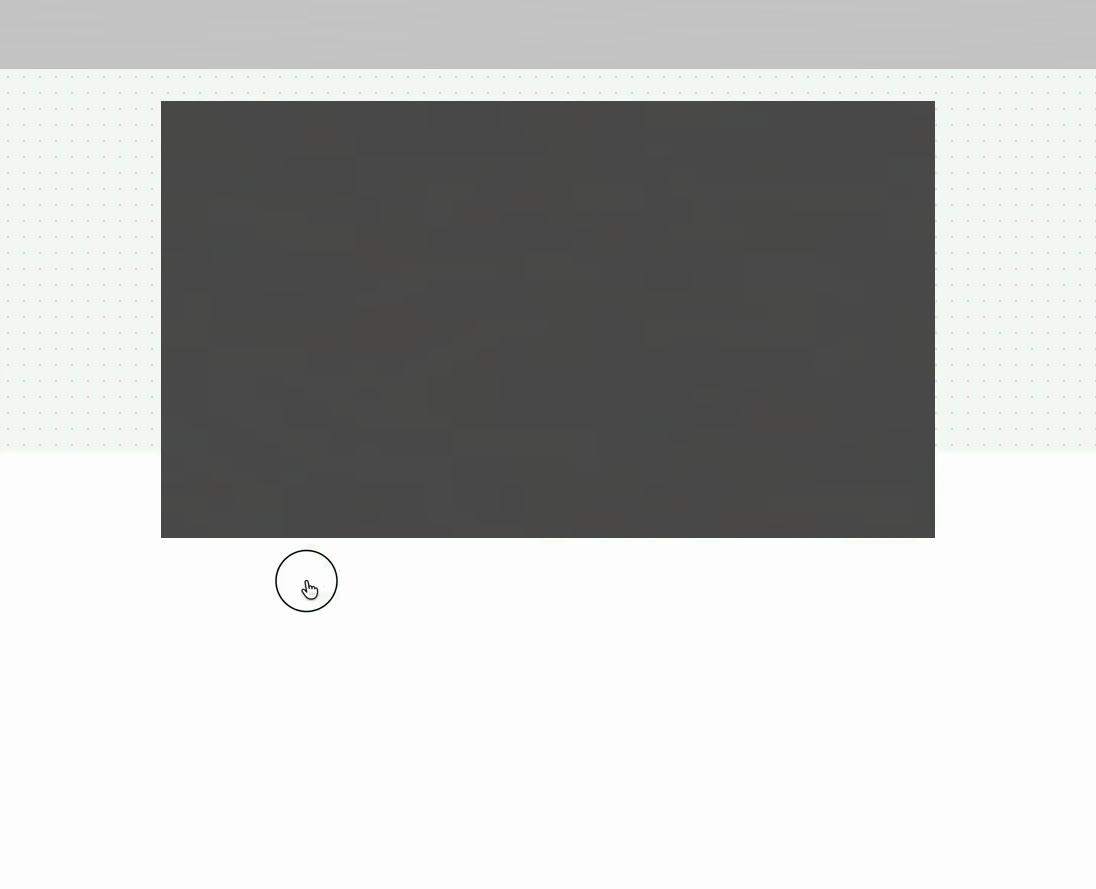
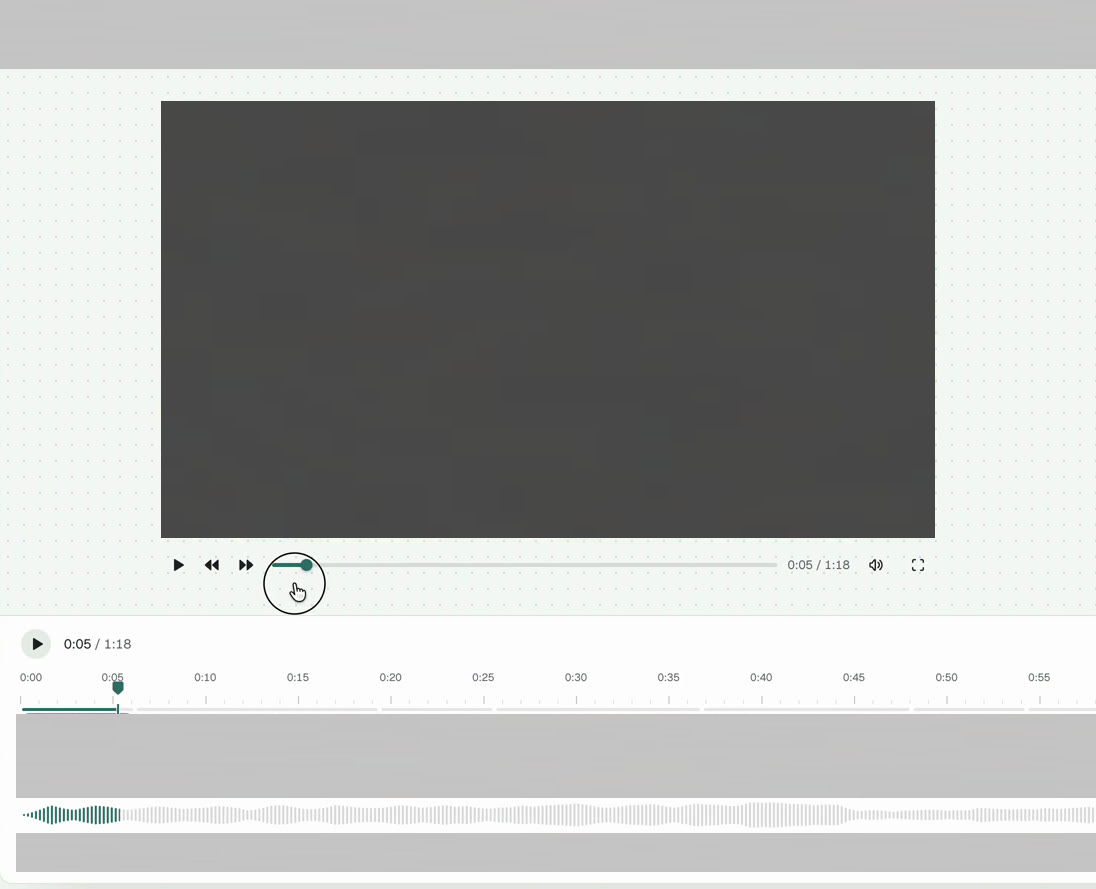
The controls and the timeline are gone. The film is still there, and so is the top half of the page.
Product details are covered by opaque masks, and the settings panel is cropped out. The visible background, playback controls, and missing tile boundaries are unchanged.
The shape of the missing area was the first useful clue. It did not follow the edge of a component. It was a straight horizontal cut across the page, taking part of the dotted background with it as well as the timeline. That made a problem with an individual UI component less likely.
The position of the cut was useful too. In two frames, it started 451 pixels from the top of the recording. In the third, it started at 675 pixels. The difference was 224 pixels, almost exactly a quarter of the window's height.
Those measurements gave us something specific to compare with the browser's rendering work.
Why Such a Small Change Repainted So Much
Chrome does not paint the whole page as one picture. It divides content into layers and paints those layers in smaller regions called tiles. In this window, the tiles in the page's main layer were as wide as the window and roughly a quarter of its height. On my retina screen, each row was 448 physical pixels high, corresponding to 224 CSS pixels.
The missing areas lined up with those tile rows. The recording suggested that whole tiles were appearing blank, rather than individual components disappearing.
The bottom two rows were also the ones the seek interaction kept asking Chrome to paint again. The playhead, progress fills, seek bar, and time labels were painted into the page's main layer. When those elements changed, the browser repainted the affected tiles, including the static content in them.
Moving a playhead only two pixels wide was causing a strip as wide as the window to be painted again, including all the thumbnails in that strip.
Chrome's trace records which tiles it paints and which layer they belong to. In one backward drag consisting of 120 mouse moves, the main layer had 267 tile repaints. That was roughly two per move, with a few additional repaints.
The example below models this behavior. Drag the seek bar and watch the bottom two rows. You can also turn on the heavy scene and compare the work before and after the fix.
This is a model of what Chrome did, so the flash is easy to catch. The real numbers from my trace: 267 page tiles painted in one drag before the fix, 9 after.
What I Could and Could Not Confirm
The gallery scene asks the most from the GPU. My best explanation is that, under that load, Chrome sometimes presented a frame before the repainted tiles were ready. Those regions appeared blank for one frame, while the video preview remained visible on its own layers.
But I did not capture that step directly. The headless tests and browser captures did not reproduce what appeared on my display. Their 661 clean frames showed that the timeline was present in those captures; they did not explain why it disappeared on my screen.
What I could confirm was that the missing regions matched the tile rows being repainted during every seek. After the change described below, those repeated main-layer repaints stopped, and I could no longer reproduce the flicker on my screen.
I also do not have a measured explanation for why dragging backward was worse than dragging forward. My guess is that moving forward gives the preview more time to prepare the next scene. I would need another measurement to know whether that is actually the reason.
Moving the Changing Elements to Their Own Layers
Once I knew which elements were causing the repaints, I could change how they were handled without changing the rest of the timeline.
I added will-change: transform to those elements. The property gives the browser a hint that an element's transform may change, so it can prepare for that work. In this case, Chrome promoted the elements to their own composited layers, separating their updates from the page's main layer. The playhead in the example below still moves through changes to left; the benefit was the layer separation, not a switch to transform-based movement.
/* The app moves this on every seek. It was painted into the page's main layer. */
.playhead {
  position: absolute;
  left: 37%;
}

/* The same element, now on a layer of its own. */
.playhead {
  will-change: transform;
}
I applied it to the small elements that update during a seek. The trace showed how the work changed:
| Part | Before | After |
|---|---|---|
| Playhead, ruler head | Two page tiles painted again | The layer moves. Nothing is painted. |
| Time labels, scene names | A page tile painted again | A layer the size of the text is painted |
| Progress fill, waveform fill | A page tile painted again | Their own thin layer is painted |
The same drag now produces 9 tile repaints in the page's main layer instead of 267. I tested it again on my screen, and the flicker was gone.
Why I Only Applied It to Those Elements
The useful part of this fix was choosing which elements to separate. I would not apply will-change to the whole interface based on this result.
Putting the whole timeline on its own layer would still leave the changing playhead and fills sharing that layer with the thumbnails. Their updates could still require large regions to be painted again. I wanted to separate the small things that changed from the much larger area that stayed the same.
Each layer also uses GPU memory. A few small layers were a reasonable cost here, but applying the property to many large elements could create a different performance problem.
Before making the change, I needed to understand which updates caused a repaint and how much of the page each repaint covered. The property helped because I had narrowed that work down to specific elements.
What I Would Check Earlier Next Time
In my earlier post about React performance, I wrote about the work that happens after React updates a page. This bug gave me a more specific example of why that distinction matters.
The playhead needed to update on every seek. Even if the React work had been as efficient as possible, changing its position still caused the browser to repaint a much larger area. The cost I needed to reduce was in painting, rather than repeated JavaScript work.
I should also have recorded my screen earlier. The traces helped measure the work, but I spent too long expecting the browser captures to show a problem they had not reproduced. A short recording gave me the missing regions and their exact positions, which was enough to connect the visible symptom to the tile repaints.
The before-and-after counts were useful for a different reason. Going from 267 tile repaints to 9 showed that the change reduced the work I intended to reduce. It did not prove that the flicker was gone; I still needed to repeat the interaction on the screen where I had seen it.
The flicker is gone in my tests, but there is still work I could improve. The two fills are painted on every seek, although now only in thin layers of their own, and the gallery scene is still as heavy as before. If the flicker returns, those are the parts I would investigate next.
The lesson for me is to measure the browser work and recognize when my tools are not reproducing what I can see, rather than treating will-change as a general fix.
Rarely, but worth it
A short note whenever I publish something new.
Plus one newsletter-only post each month.