
Why React Apps Feel Slow
Most React performance bugs are really JavaScript, DOM, hydration, or scheduling problems.
I keep coming back to the same conclusion when a React app feels slow: most of the time, React is not the real problem.
Usually it is one of four things:
- you are doing too much JavaScript work
- you are asking the browser to manage too much DOM
- you are forcing expensive browser work after React commits
- you are treating non-urgent updates as urgent
React is only one part of that pipeline. It does not control the whole thing.
That matters because a lot of React performance work turns into fake work. The app feels slow, so people start wrapping random components in memo, adding useMemo in places they have not measured, and hoping the profiler looks better. Sometimes that helps a little. Usually it just adds complexity while the real bottleneck stays exactly where it was.
The better question is not How do I optimize React? It is Which part of the pipeline is actually expensive, and why?
This article is really about that pipeline, not just React render time. The whole thing:
- JavaScript execution
- React render and commit
- style and layout work
- paint and compositing
- hydration
- scheduling
- and the gap between "pixels appeared" and "the UI feels responsive"
Once you know where the time is actually going, the fix usually stops feeling mysterious. If you get that part wrong, you can spend days "optimizing React" while the browser is busy with layout, the main thread is blocked by a long task, or hydration is eating the first interaction.
React Runs Inside a Frame Budget
The browser does not care that your code is written in React. It still has to fit everything into a tight frame budget if you want the UI to feel smooth. On a 60Hz display, missing that budget means dropped frames. On faster displays, the margin is even smaller.
That budget gets shared across a lot of work:
- JavaScript
- style calculation
- layout
- paint
- compositing
- input handling
Not every part always runs on the same exact thread in every browser implementation, but that is not the part that usually helps in practice. The more useful model is simpler:
Your JavaScript can monopolize the part of the browser pipeline that gates responsiveness.
Once that happens, the UI feels bad whether React was technically "fast" or not.
Why One Slow Task Makes the UI Feel Broken
Most frontend performance bugs are not that fancy. They usually come from one boring fact: if you keep the main thread busy for too long, everything else waits.
That includes:
- the next input event
- the next animation frame
- the next paint
- and often the next meaningful piece of UI feedback
This is why a page can feel broken even when React is doing exactly what it is supposed to do.
If a keystroke triggers:
- a large synchronous filter
- a tree-wide rerender
- a DOM-heavy commit
- and follow-up layout work
the user does not experience those as separate stages. They just feel input lag.
That is usually the right way to think about UI performance:
not as isolated "React problems," but as different kinds of work fighting over responsiveness.
React Decides. The Browser Still Has Work To Do.
React does not paint pixels. React calculates UI updates, then commits DOM changes, and then the browser takes over. That handoff is where a lot of the confusion starts.
React has two phases that matter here:
- render phase: React runs component logic and figures out what changed
- commit phase: React applies those changes to the real DOM
After commit, the browser may still need to:
- recalculate styles
- recompute layout
- repaint parts of the page
- composite layers into a final frame
That is why looking only at "render time" is not enough. A render can be cheap and still lead to an expensive frame. A commit can be tiny and still invalidate a large layout subtree. A page can paint quickly and still feel dead because hydration is not finished.
Most React Performance Bugs Fall Into Four Buckets
When a React app feels slow, it is usually paying for one of these:
- repeated JavaScript work
- too much live DOM
- forced browser work after commit
- bad scheduling
There are other edge cases, but these four explain most of what people end up debugging in real apps.
1. Repeated JavaScript Work
This is the classic render-cascade problem. The app updates one thing, but React ends up re-running a lot more code than that interaction actually needed.
That repeated work can come from:
- parent rerenders that wake large subtrees
- unstable object or function props that break bailouts
- expensive child components rerendering on every keystroke
- broad context updates that fan out through the tree
- heavy derived computations running on every render
This demo shows the classic render cascade. The parent updates once, but most of the work below is just noise because only one part of the tree actually needed to change.
Controls
Type or trigger state updates and watch the flash overlay move through every child.
Render Tree
Three boxes are marked wasted because their output is unchanged, but React still re-runs them.
a single parent update fans out through the entire subtree unless children can bail out
The important point here is not "rerenders are bad." React rerendering component functions is normal. The problem is rerunning expensive or widespread work for updates that should have stayed local.
Good teams usually fix this earlier in the architecture:
- move state closer to where it is used
- stop passing unstable props through large trees
- isolate expensive children behind stable boundaries
- split hot state from cold state
Memoization helps, but it is usually a later fix, not the first move.
2. Too Much Live DOM
Sometimes React is not the expensive part at all. The expensive part is keeping a huge amount of UI alive in the DOM.
Large DOM trees increase:
- memory pressure
- style recalculation cost
- layout cost
- paint cost
- scroll overhead
That is why giant lists feel bad even when each individual row looks cheap in isolation.
React can finish quickly and the page can still feel slow. Once the browser has to lay out thousands of nodes, even tiny forced reflows start getting expensive.
Controls
Increase the node count, then force the same reflow loop and watch the browser budget disappear.
Dom surface
This is intentionally simple markup. The point is the browser still has to keep track of every node.
same code path, different browser cost once the DOM gets large
The browser pays for scale, not just for complexity. If you render thousands of nodes, you are asking the engine to continuously manage thousands of boxes, styles, and paint regions. At some size, that cost dominates everything else.
3. Forced Browser Work After Commit
React can finish its work and you can still lose the frame. Usually that means the browser is doing expensive follow-up work after the DOM changes land.
Common causes:
- layout thrashing
- large style invalidation
- expensive paint regions
- DOM mutations that trigger broad reflow
Layout thrashing is the easiest example to see. If JavaScript keeps alternating between reading layout and writing DOM changes, the browser loses its chance to batch the work efficiently.
Browsers want to batch layout work. If JavaScript keeps alternating between reading layout and writing DOM changes, the browser gets forced into repeated synchronous reflows.
Controls
Switch between the bad loop and the batched loop, then run the exact same DOM operation.
DOM Surface
The boxes are cheap. The bad read/write order is what turns this into a frame killer.
200 forced layout reads mixed into writes
This is one of the places where people misdiagnose the issue all the time.
They see a slow interaction and blame React rerenders. In reality, React may be fine. The expensive part may be the layout work you forced after commit.
4. Bad Scheduling
Some updates are expensive because they are large. Others are expensive because they happen at the wrong priority. Typing into an input is urgent. Recomputing a big result list from that input is often not urgent.
If both happen at the same priority, the slow work competes directly with the feedback the user cares about most.
That is how you end up with interfaces that technically work, but feel heavy.
Scheduling problems became much more visible as React apps turned into editors, dashboards, collaborative tools, and AI-heavy interfaces. Those products are full of updates that matter, but not all of them matter right now.
Stop Guessing: Measure the Right Thing
Once you have those four buckets in your head, the next step is not "optimize." It is "figure out which kind of work is actually hurting you."
Start with the symptom:
- typing lags
- scrolling janks
- first interaction feels dead
- one route feels heavy after data loads
- an animation drops frames during unrelated state changes
Then ask which class of work fits that symptom.
If typing lags, likely suspects are:
- repeated JS work
- expensive children rerendering
- large synchronous computations
- urgent and non-urgent updates competing
If scrolling janks, likely suspects are:
- too much live DOM
- expensive layout or paint
- heavy scroll handlers
If the page looks ready but does not respond, likely suspects are:
- hydration
- bundle cost
- mount-time client work
That step removes a lot of fake optimization work. Before you add useMemo, you should know whether the bottleneck is even repeated JavaScript work. Before you blame React render time, you should know whether the browser is paying the real bill after commit.
React DevTools Profiler and React Scan
This is where tooling becomes useful. The React DevTools Profiler helps you inspect render frequency, render duration, and what rerendered during an interaction.
React Scan is useful for making rerender behavior obvious in real time, especially when you are trying to spot noisy subtrees quickly.
Open the example below to see how React Scan marks rerenders:
The main thing to avoid here is superstition. If you do not know:
- what rerendered
- why it rerendered
- how expensive that rerender was
- and whether the work was even user-visible
you are not really doing performance work. You are just guessing.
Match the Fix to the Bottleneck
Once you know what kind of work is expensive, the fixes get much more targeted. The mistake is treating every optimization tool like it solves the same problem. It does not.
- memoization reduces repeated JavaScript work
- virtualization reduces DOM scale
- transitions and deferred values improve scheduling
- SSR and RSC strategies change when and where work happens
- workerization moves suitable computation off the hot path
If you use the wrong tool for the wrong bottleneck, you usually just buy more complexity without making the UI feel much better.
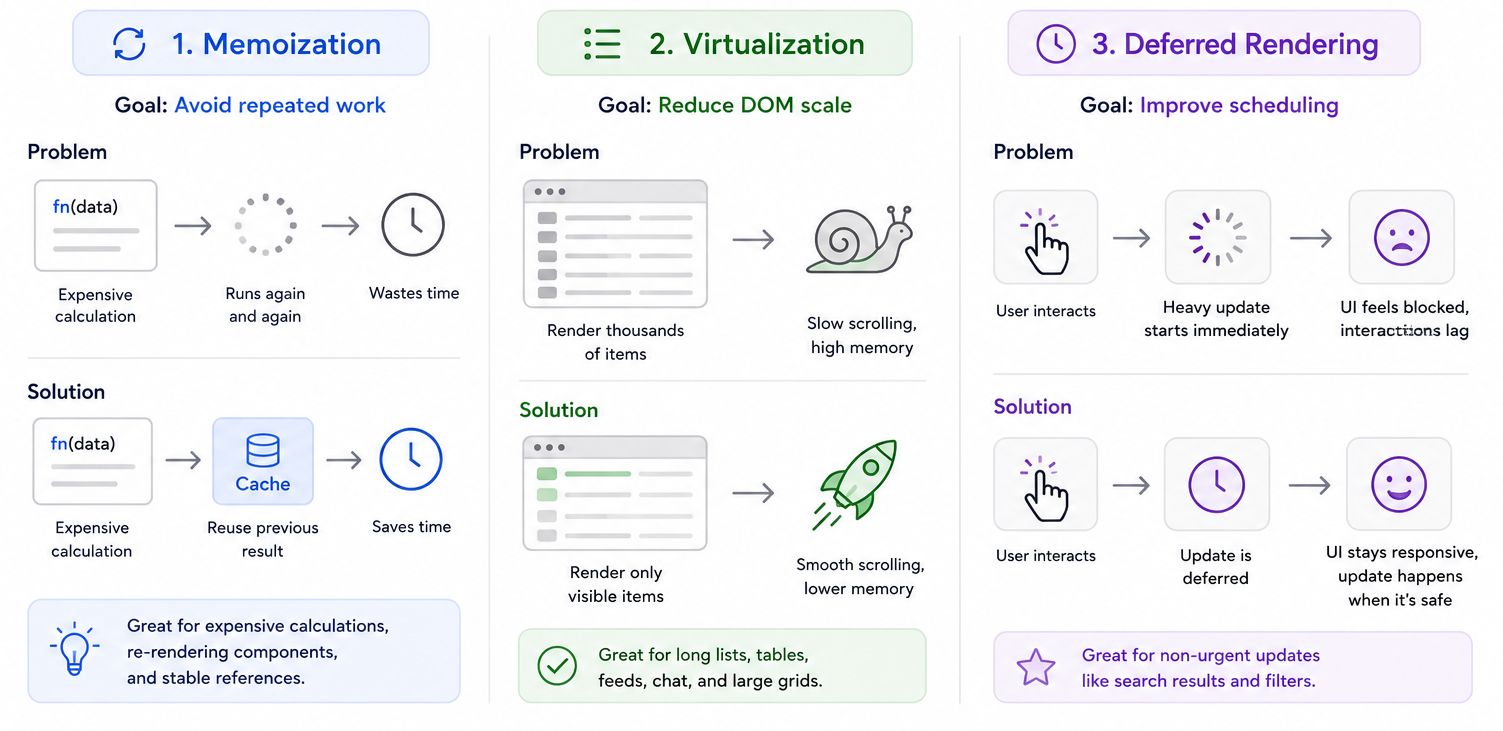
Memoization Fixes Repeated Work, Not Everything
Memoization is useful when the problem is repeated JavaScript work. It is not some general performance blessing.
React gives you a few ways to avoid redoing work:
memofor component-level bailoutsuseMemofor expensive derived valuesuseCallbackfor stable function identity when identity actually matters
The trap is obvious: once people learn these APIs, they start using them everywhere just in case.
That usually means:
- extra comparison cost
- extra memory retention
- harder-to-read code
- and very little real benefit
The right question is not "can I memoize this?" It is What repeated work am I avoiding, and is that work expensive enough to matter?
A parent rerender does not have to mean redoing every child. useMemo caches expensive derived values and memo lets unchanged rows bail out, so the work only happens when the inputs actually change.
Controls
Toggle memoization off and watch the work counter climb on every parent rerender.
List
Press the parent rerender button. With memoization on, the work counter should stay still.
scores are cached and rows skip rerendering when nothing about them changed
Some blunt rules help here:
- If the child is cheap,
memousually does not matter. - If props are unstable,
memousually does not help. - If the real cost is layout, paint, or hydration, memoization is the wrong tool.
- If moving state down removes the rerender entirely, that is usually better than memoizing half the tree.
Memoization is best when you already found a hot path and can show that the same expensive work keeps repeating with the same inputs.
Virtualization Fixes DOM Scale
Virtualization solves a different problem. It does not make a giant list cheap through magic. It makes the list cheaper by not keeping the whole thing mounted in the first place.
Virtualization is not about caching work, it is about doing less of it. Instead of mounting every row in the list, only the visible slice exists in the DOM at any time. As the user scrolls, rows above and below the viewport are unmounted and replaced.
Controls
Turn virtualization off to mount the whole list at once, then try scrolling.
Large list
The list has 2,000 rows. Scroll it with virtualization on and off.
only the visible rows exist in the DOM, so scrolling stays smooth on any list size
That is why virtualization is such a clean optimization. The browser cannot struggle with DOM nodes that do not exist.
This is one of the clearest performance lessons in frontend:
Sometimes the fastest render is the one you never ask the browser to manage.
That said, virtualization is not free either. It introduces tradeoffs:
- more measurement logic
- trickier keyboard navigation
- accessibility work
- scroll anchoring edge cases
- harder find-in-page behavior
- more complexity around dynamic row heights
So the rule is not "always virtualize." If DOM scale is the bottleneck, reduce DOM scale.
Concurrency Is About Interruptibility, Not Speed
When React introduced concurrent rendering capabilities, a lot of people talked about them like they were mostly a speed feature. I do not think that is the right frame. Concurrent React does not make expensive work disappear.
It makes it easier for React to interrupt, reprioritize, and delay work so urgent interactions stay responsive.
That is why APIs like useDeferredValue and startTransition matter.
They are not "optimize later" buttons. They are ways to tell React that some updates can lose the race.
If the user types into an input, the input should win.
If a giant list below the input needs another expensive pass, that update can often wait a beat.
Type into the input and switch sort modes. The input is critical UI. The list recomputation is not. useDeferredValue lets the list trail behind the input, anduseTransition marks sort changes as lower priority work.
Controls
Turn each hook off to feel the expensive list fight the input and sort updates.
Expensive list
This list does fake ranking work every time its query or sort changes.
critical updates stay immediate while the slow list is allowed to fall behind
That shift matters because modern React performance is not only about making rendering faster. A lot of it is about protecting urgent interactions from other work that can wait.
Useful rule of thumb:
- If the user is waiting on direct feedback, the update is probably urgent.
- If the update can be briefly stale without hurting the interaction, it is a candidate for lower priority scheduling.
Hydration Buys Fast Paint and Sells You CPU Debt
Hydration is where a lot of modern frontend performance claims start falling apart. The page can look ready long before it behaves ready. That is the trap.
Server-rendered HTML improves how quickly content appears.
It does not guarantee that:
- the JavaScript bundle is loaded
- client components have executed
- listeners are attached
- mount-time work has finished
- the first real interaction will be responsive
Hydration is the cost of turning server-rendered markup into a live client-side React tree.
That cost usually includes:
- downloading client JavaScript
- parsing and executing it
- building the client-side React tree
- reconciling it against existing DOM
- attaching listeners
- running mount-time client code
The page paints almost immediately, but React still has to parse and execute the client bundle before any of the buttons or inputs work. During that window the UI looks ready and quietly drops everything you do.
Controls
Choose a bundle size, then reload. Try interacting before hydration finishes.
Fake page
Press reload, then immediately try to click the button or type into the input.
a big client bundle blocks the main thread for over a second after the page is visible
This is why so many apps look fast in screenshots and still feel slow when you actually use them. They optimized first paint and quietly moved a large amount of CPU work into the moment right after paint, exactly when the user starts trying to interact.
That is the real cost of hydration. It is not just bytes over the wire. It is main-thread work at the worst possible moment.
This is also why newer frontend architectures keep pushing toward:
- less client JavaScript
- narrower client boundaries
- server components where possible
- streaming where it helps
- and avoiding hydration for UI that does not need to wake up immediately
Not all of those techniques solve the same problem, and they should not be treated like synonyms. But they all come from the same realization: shipping less client work is often more valuable than getting HTML on screen slightly earlier.
A Practical Diagnostic Loop
If a React interface feels slow, this is a better order of operations than "add useMemo and pray":
- Identify the user-visible symptom.
- Capture the interaction in the browser profiler and React profiler.
- Classify the bottleneck:
- repeated JS work
- too much DOM
- forced layout or paint
- bad scheduling
- hydration
- Confirm which stage is actually expensive.
- Pick the smallest fix that removes or reprioritizes that work.
That last part matters. The best fix is usually not the cleverest one.
If moving state removes the rerender, do that before memoizing. If virtualization removes 95% of the DOM, do that before shaving a few milliseconds off each row. If the page is hydration-bound, stop tuning component render time and start reducing client-side work. If a transition keeps typing responsive, that may matter more than making the background list absolutely current on every keypress.
The Real Skill Is Knowing What Not to Optimize
A lot of frontend performance advice is still too component-centric. It sounds like this:
- use memoization
- split components
- debounce input
- lazy load more things
None of that is wrong. It is just incomplete.
The real skill is knowing which work is not worth doing at all. That might mean:
- not rerendering a subtree
- not mounting 2,000 rows
- not hydrating below-the-fold UI right away
- not running a heavy calculation on every keystroke
- not treating background updates as urgent
Most good frontend performance work is subtractive. You remove work, narrow work, or delay work. You do not just decorate the same work with more hooks.
Rarely, but worth it
A short note whenever I publish something new.
Plus one newsletter-only post each month.